
What Is Looker Studio?
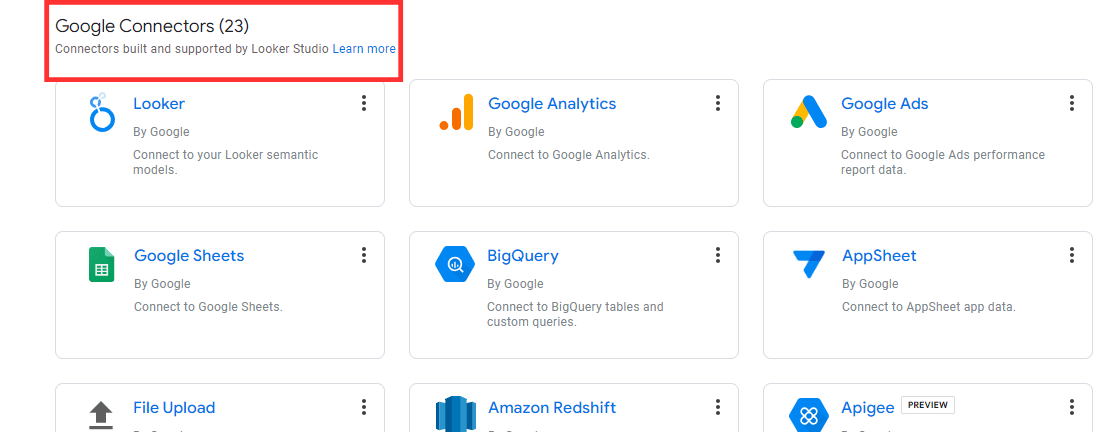
Looker Studio, formerly known as Google Data Studio, is a robust platform designed for data visualization. It connects seamlessly with various data sources — like Google Analytics, Google Ads, and even non-Google platforms — allowing you to create highly customizable reports and dashboards. These visualizations simplify complex data, enabling you to make informed decisions quickly and share insights with your team or clients.
Why Use Looker Studio?
Looker Studio makes the process of collecting, analyzing, and presenting data far less daunting. Here are some key benefits of using this tool:
Easy Configuration of Data Sources
Connecting your data sources is incredibly straightforward. Whether it’s Google Analytics, spreadsheets, or external databases, Looker Studio offers flexibility with its broad integration capabilities. This means you can gather all the data you need in one place, making your reporting workflow smoother.
Many Data Visualization Options
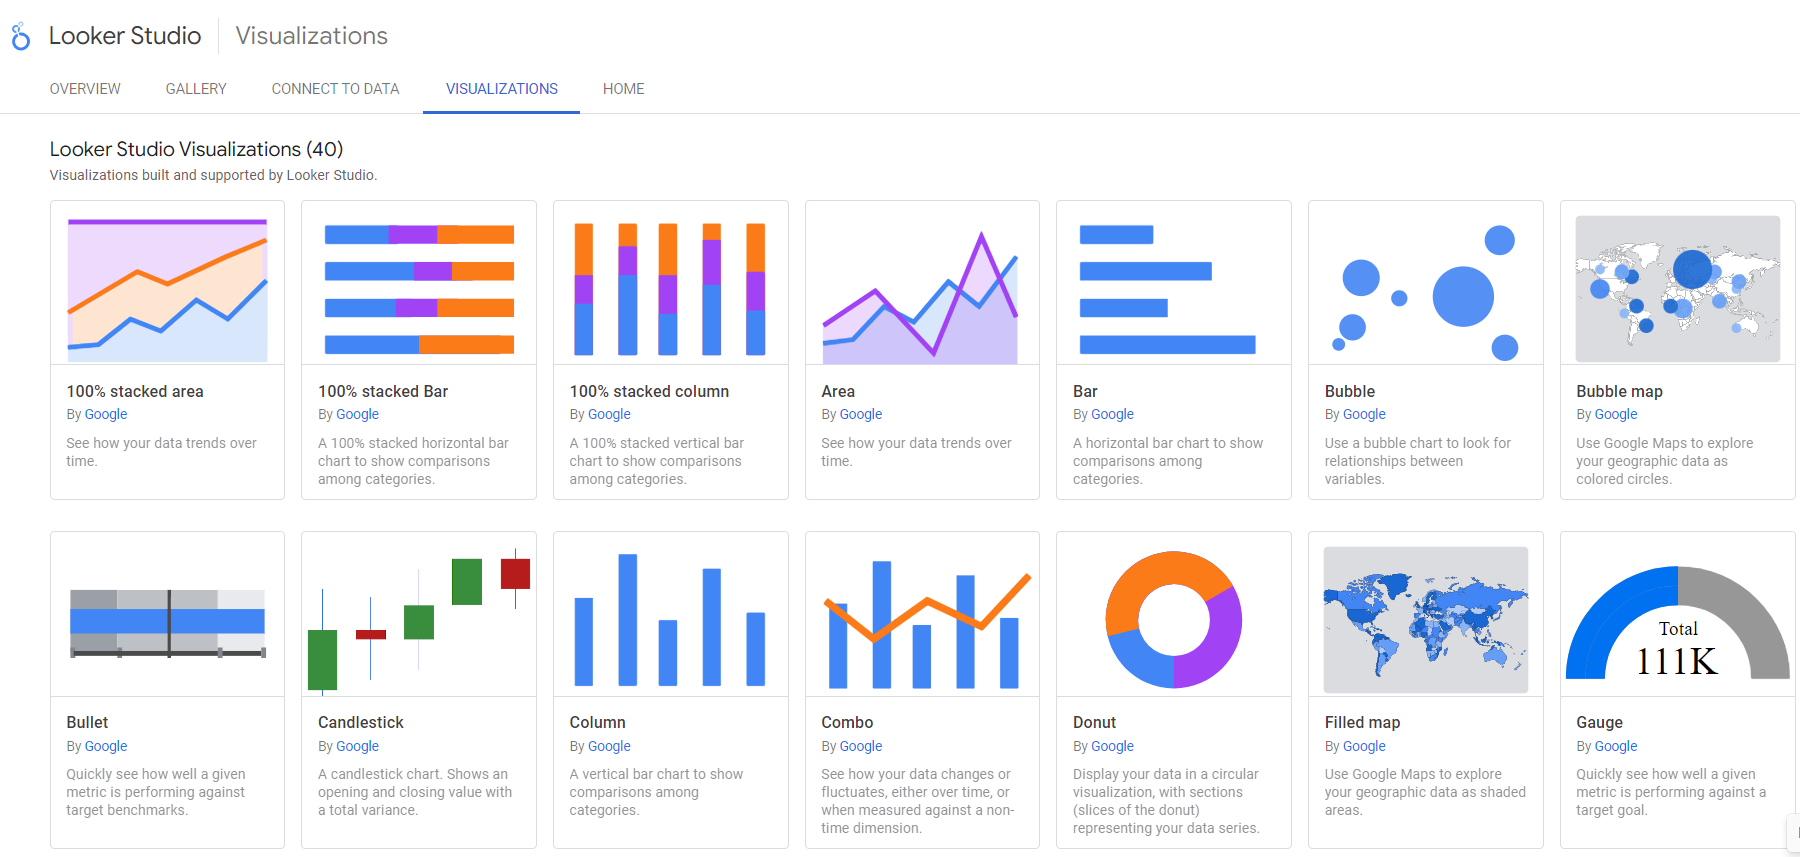
With a range of visualization styles, from charts to tables, Looker Studio allows you to present data in a way that makes the most sense for your audience. There are endless configuration options to choose from, whether you need a detailed breakdown or a high-level overview.
Collaboration and Sharing
Need to work with your team on reports or share insights with stakeholders? Looker Studio enables seamless collaboration. You can easily share your dashboards with anyone—whether across the office or around the world. Plus, you can control access and manage permissions, ensuring the right people see the right data.
Speedy Report Creation
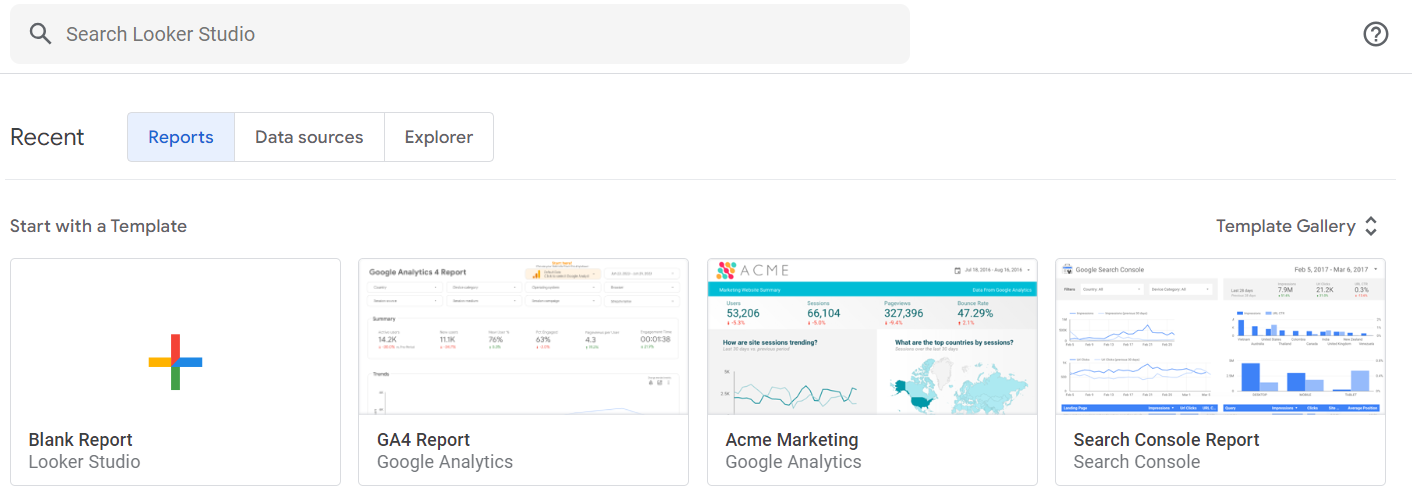
For those looking to save time, Looker Studio offers pre-built sample reports, so you don’t have to start from scratch. These templates allow you to quickly plug in your data and create professional-quality reports in minutes.
How to Visualize Google Analytics Data in Looker Studio
One popular use case for Looker Studio is integrating Google Analytics data. Here's a quick guide on how to create visualizations:
- Log in to your Google Analytics account.
- Navigate to the account, service, or view you wish to analyze.
- Go to Customization > Dashboards or Customization > Custom Reports.
- From there, select one of the Looker Studio templates containing your data.
With just a few clicks, you can visualize data such as audience demographics, acquisition sources, and user behavior. This integration is particularly useful for marketers and website owners looking to track and improve performance.
For more advanced users, you can also blend data from different sources in Looker Studio to gain even deeper insights. Be sure to check out our complete guide on blending data in Looker Studio to master this feature.
Fun Fact: Looker Studio’s Evolution
Originally launched as Google Data Studio, the platform was rebranded to Looker Studio after Google acquired Looker, a major player in the business intelligence (BI) space. This acquisition enabled Google to combine Looker’s powerful BI capabilities with its own data visualization tools, making Looker Studio a one-stop shop for data reporting and analysis.


![[audit]flow](https://cdn.prod.website-files.com/682c0e3550b0b907e17394ea/682c0e3550b0b907e1739a5a_%5Baudit%5Dflow.avif)
