What is the GA4 Conversion Paths Report?
The GA4 Conversion Paths report offers a chronological map of the touchpoints that users interact with before completing a conversion on your site. These touchpoints include various channels, sources, mediums, and campaigns that users may engage with along their journey.
Here’s why it’s very useful for marketers:
- It provides clear insights into the user’s conversion journey across multiple platforms.
- It highlights which channels contribute most effectively to your conversions.
- It helps identify opportunities to enhance customer experiences and increase conversions.
What are the Touchpoints in Conversion Paths?
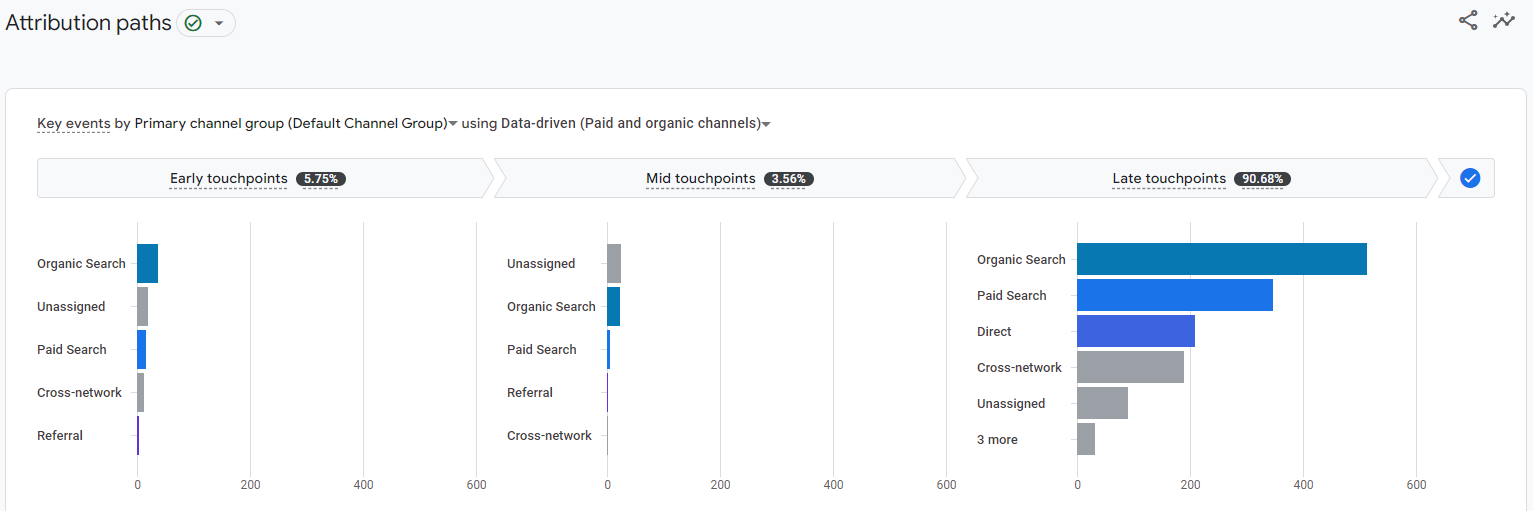
Touchpoints are the various channels, sources, or campaigns that users engage with before they convert. The GA4 Conversion Paths report groups these into three main stages:
- Early Touchpoints: These are the initial interactions users have with your brand. For example, someone might first find your site through a Google search or see your ad on social media. It’s the starting point in their journey.
- Mid Touchpoints: After the first interaction, users often continue exploring. This could be revisiting your site, clicking a follow-up email, or watching a product review. It’s the "consideration" phase before they decide to act.
- Late Touchpoints: These are the final interactions that happen just before a user converts. It might be a direct visit to your website or a final click on an email offer. These touchpoints seal the deal.
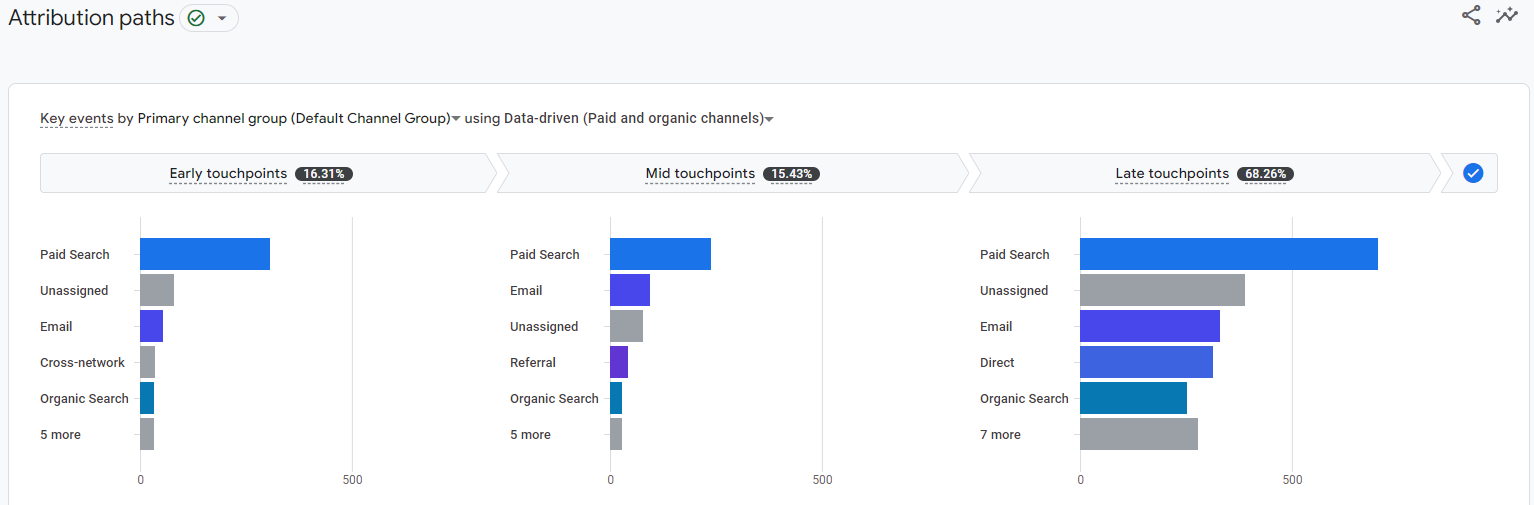
By understanding these stages, you can see how different marketing efforts work together to guide users through their journey, from discovery to conversion.
Example of a Conversion Path
Consider a hypothetical user named John Doe who wishes to purchase an online course:
- Searches on Google and clicks on an organic link to your site.
- Returns a week later and clicks on a paid ad.
- Finally, he visits your site directly and completes the purchase.
The Conversion Paths report captures this journey chronologically, detailing how many times John engaged with each touchpoint before converting.
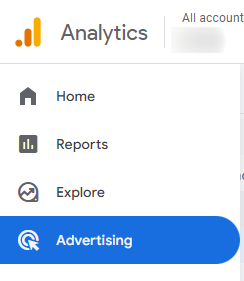
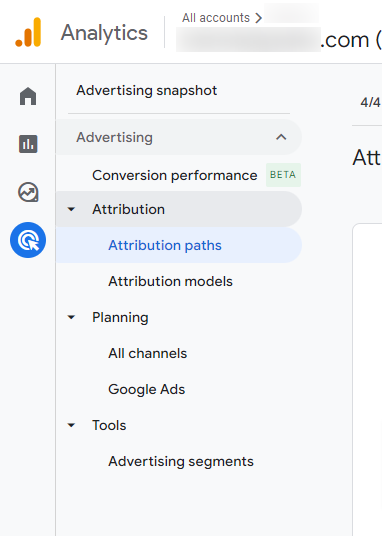
Accessing the Conversion Paths Report in GA4
To find the Conversion Paths report:
- Go to the Advertising section in your GA4 dashboard.
- Click on Attribution, and then select Conversion Paths.
This report includes 2 key sections:
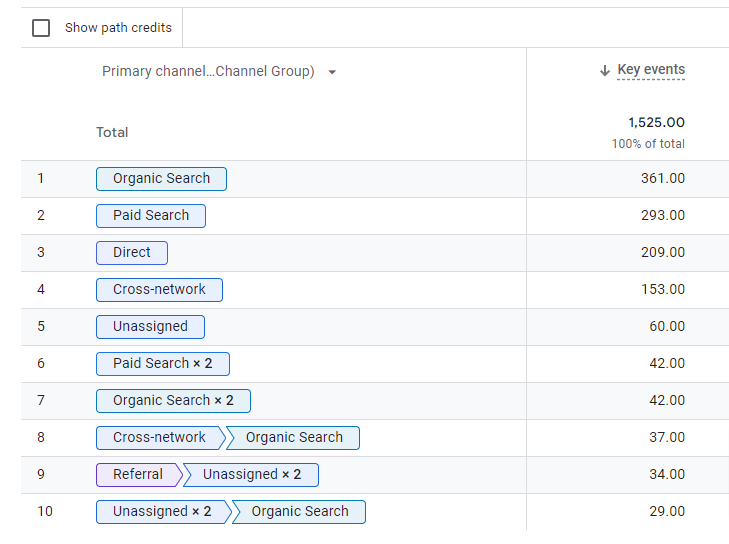
- A graphical representation of the top five conversion channels.
- A detailed table listing all conversion paths, including the number of conversions, revenue generated, and the average time it took for users to convert across different paths.
Analyzing the Data: What Can You Learn?
The Conversion Paths report provides several insights that can help you better understand the effectiveness of your marketing channels.
Top Conversion Channels
The report shows the top-performing channels that lead to conversions. Unlike simple traffic data, it focuses on conversion metrics, revealing which channels are genuinely driving results. For example, an organic search may bring in traffic in the early and middle stages, but direct visits might dominate as the conversion nears.
Detailed Insights from Conversion Paths
The detailed table allows you to dig deeper into the data. You can see:
- The total number of conversions from each path.
- The revenue generated from each conversion path.
- The average time it took users to convert from the first touchpoint to the final conversion.
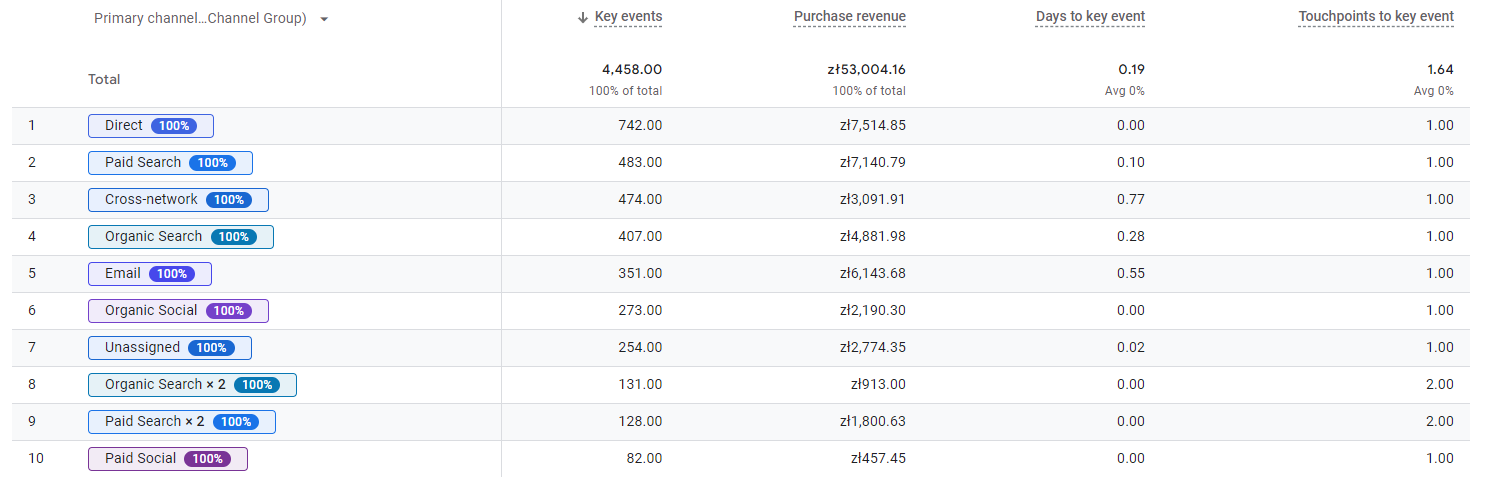
This information can help you adjust your marketing strategies. For example, if you notice that users often revisit your site multiple times before converting, you may want to focus on re-engagement campaigns or retargeting ads.
Customizing Your Analysis
GA4 allows you to tailor your Conversion Paths report based on specific criteria, such as touchpoint count or conversion events.
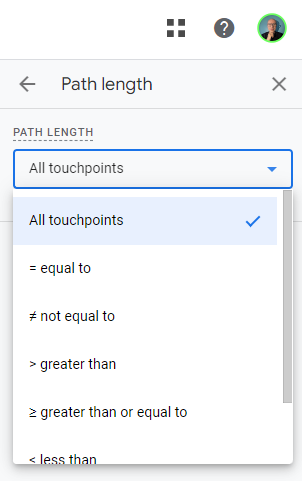
Filtering Touchpoints by Path Length
You can filter conversion paths based on the number of touchpoints. This allows you to focus on shorter or longer journeys, depending on your marketing objectives. For instance, you may want to see how many users convert after one interaction versus those who need several.
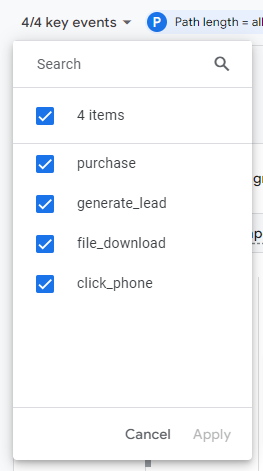
Analyzing Specific Conversion Events (Key Events)
You can also filter the report by specific conversion events (such as purchases, sign-ups, or downloads) to see which marketing efforts lead to those particular actions. This focused analysis can help you optimize specific parts of your sales funnel.
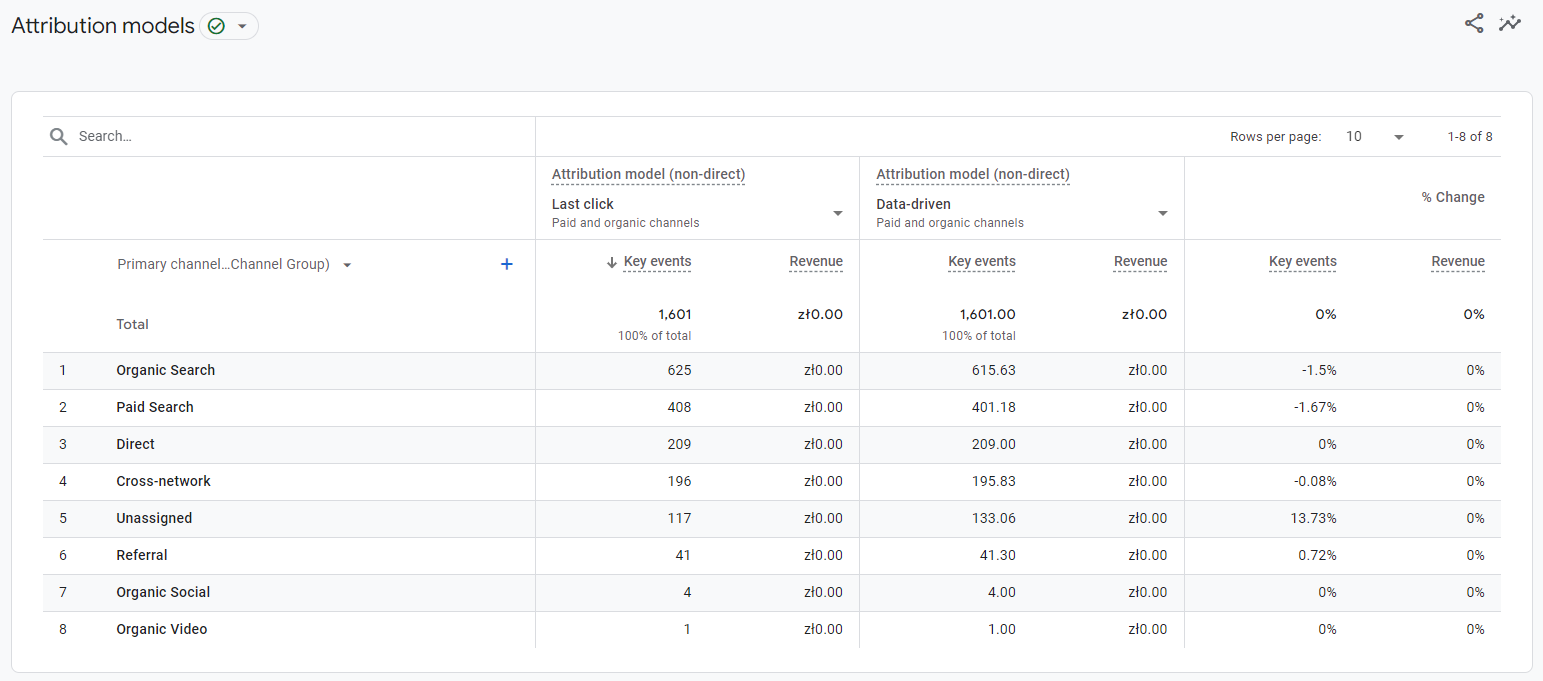
Attribution Models in GA4
GA4 offers two attribution models to help you understand how credit is assigned to different touchpoints:
- Data-driven Attribution: GA4’s default model that uses AI to distribute credit based on user behavior.
- Last Click Attribution: Assigns full credit to the last touchpoint a user interacted with before conversion.
Understanding the nuances of these models can significantly impact how you interpret conversion data. For example, if you rely on last-click attribution, you might overestimate the value of certain channels while underestimating the contributions of early touchpoints like organic search or social media ads.
Trouble: What If You See “No Data Available”?
If you run into the dreaded “no data available” message, here are a few things to check:
- Verify that your selected date range includes conversion events.
- Double-check that you’ve selected conversion events to analyze.
BONUS: Exploring Conversion Paths in GA4
Sometimes, clients ask a specific question: “What was the user doing before the conversion event?” To answer this, you can utilize the Path Exploration feature. Follow these steps:
1. Navigate to Path Exploration: In GA4, select Explore from the left-hand menu, then choose Path exploration. This technique allows you to visualize the sequence of events leading up to a specific conversion.
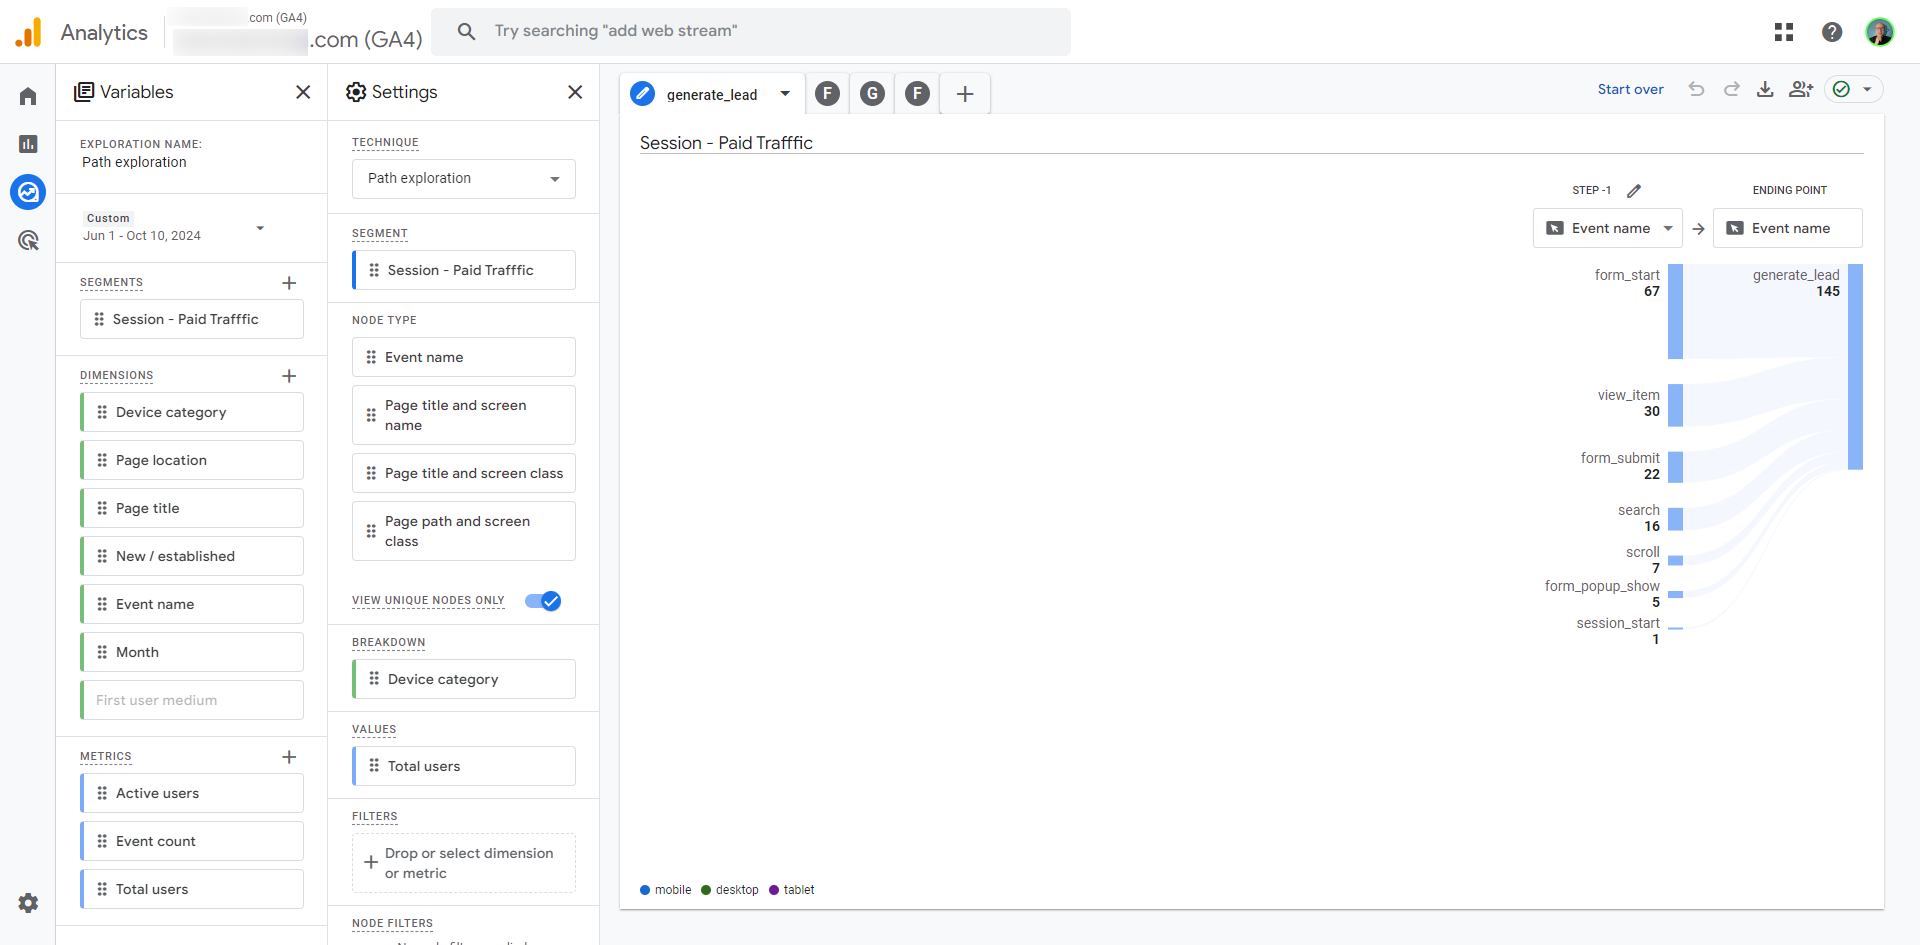
2. Set Your Starting Point: In the Path Exploration setup, define your starting point by selecting a relevant event, such as session_start or the specific form_start event if you're analyzing lead generation. This will give you insight into user behavior from the start of their session.
.png)
.png)
3. Choose Starting point or Ending point by dragging or selecting a node from the options available (in this case, it’s “generate_lead” for conversions).
This allows you to see what led up to the conversion or what happens after a specific user action.
.png)
4. Select Relevant Dimensions: You can enhance your analysis by choosing dimensions such as Event name, Page title and screen name, or Page path and screen class. This helps you identify what specific actions (e.g., page_view, click_button) occurred prior to the conversion.
.png)
5. Visualize the Path: After setting your nodes, GA4 will generate a visual path showing the sequence of events. You can analyze this flow to understand user interactions leading up to the conversion event, revealing patterns or common behaviors.
By leveraging the Path Exploration feature, you can gain valuable insights into user journeys and optimize your marketing strategies accordingly.
For a more in-depth understanding of using GA4 explorations, check out this GA4 Exploration Guide.